Knowledge Pit Stops

Back in 2009, I blogged about some heart-warming examples of cross-industry peer assists,  involving Great Ormond Street Hospital and the Ferrari Formula 1 pit team.  Geoff and I wrote the story up fully in our second book, "No more Consultants". The specific example related to the operating theatre team improving their handover processes during an operation called the "arterial switch" - and the insights of Professor Martin Elliott and his colleagues who had the curiosity and the passion to approach Ferrari and ask for help.

Image

It reminded me of Thomas Friedman's book "The World is Flat" where he wrote:

“I have concluded that in a flat world, IQ- Intelligence Quotient – still matters, but CQ and PQ – Curioity Quotient and Passion Quotient – matter even more. I live by the equation CQ+PQ>IQ. Give me a kid with a passion to learn and a curiosity to discover and I will take him or her over a less passionate kid with a high IQ every day of the week.”

I was interested to see that Formula One was in the news again this week with another example of curiosity-driven cross-sector knowledge sharing - this time with public transport.  Train manufacturer Alstom, who say that the knowledge they gained has enabled them reduce a 2-day repair job to just 4 hours.

We need more of these "I wonder" moments to bring knowledge together, where curiosity triumphs over the "but we're different" default reaction of not-invented-here cultures which drives those connections and overlaps apart.

Image

Halfway down the stairs, where good is the enemy of great.

I've been reflecting on the dangers of “staying with the herd” when it comes to knowledge sharing.  It’s easy for our organisations to reinforce this mentality, and lead to people feeling exposed as “tall poppies” is they step out and share a good practice – or professionally incompetent if they are seen to be asking for help.  I think this leads people to cluster in the middle ground of mediocrity, or to put it more kindly, a place where good is the enemy of great.

This leads me to the words of AA Milne, in his poem, “Halfway down the stairs”.

Halfway down the stairs is a stair where I sit. there isn't any other stair quite like it. I'm not at the bottom, I'm not at the top; so this is the stair where I always stop.

Halfway up the stairs Isn't up And it isn't down. It isn't in the nursery, It isn't in town. And all sorts of funny thoughts Run round my head. It isn't really Anywhere! It's somewhere else Instead!

There’s a charming version sung by Robin the Frog from the Muppet's Show on YouTube, which takes me back to my childhood!  (I'll post it at the end as a treat for you)

The River Diagram is has now become a fairly well established tool, combining the principles of positive deviance with knowledge sharing.  However, less people are familiar with its companion tool, the Stairs Diagram.

The Stairs diagram shows levels of capability (often derived from a common self-assessment tool or maturity model) plotted against the size of the improvement goal.  The example below (fictitious) shows the results of a number of healthcare-related networks who have all used a common self-assessment tool to discuss and agree their levels of networking capability against a number of practices.  They have also identified a number of targets for improvement. One of the practices in the self-assessment was "Network Leadership & Facilitation".  This is the Stairs Diagram for that practice.

Stairs Diagram
Stairs Diagram
  • The Diabetes Network is at level 5, and clearly has something to share.
  • The Quality Improvement Fellows network is at level 1, but has a desire to improve by two levels.
  • The Cardio-community is at level 2, and hasn't chosen this practice as a priority for improvement.
  • There is a cluster of networks at level 3 with no aspiration to improve, including the Health Informatics network.
  • Finally, the TB Network is at level 3, but still seeking to improve by two level.

The power of the stairs diagram is that it maps out the potential connections of highest value - connecting those who have something to share with those who have something to learn.  This is shown in the green and red areas respectively.

Having a common measure (in this case, a self-assessment tool) enabled this group of networks to identify not only the positive deviants, but also the networks with the greatest aspiration to improve.  For each "staircase", the group can be coached to use an appropriate knowledge management tool to help those in the nursery to improve, and those in the town to share. That might be a Peer Assist, offers and requests, a knowledge cafe, knowledge fair, storytelling approach, or the capture and sharing of a distinctive or excellent practice.

So with the right motivation, the right leadership and the right methods, you can help people avoid the stair where they always stop.

You thought I'd forgotten?

Lessons Lost

Following on from my last post comparing operational effectiveness with knowledge effectiveness, I’m reminded of the “Choke Model” from my BP days.  The choke model was a way of modelling production losses at every stage in the process, for example during the refining of crude oil to produce the raw materials and refined products which customers want to buy. Starting with 100%, every step in the process was analysed, and the biggest “chokes” were identified and targeted for improvement.  There is a belief in BP that the total of all of these small percentage production losses across all of its refineries was the equivalent to having a brand new refinery lying dormant!  Now when you focus it like that, it’s one big financial prize to get after.

I think there’s a similar perspective that we could take looking at the way in which knowledge is lost during our efforts to “refine it” and transfer it to customers.  Sometimes we are so upbeat about “lessons learned” and “learning before, during and after”, that we start believing that we’ve got organizational learning cracked.  Well I don’t believe that we have!

Let’s take a walk through an organizational learning cycle and see where some of the “chokes” in our knowledge management processes might be.

Imagine that you’re working with a team who have just had an outstanding success, completing a short project. There’s a big “bucket of knowledge” there, but from the moment the project has completed, that bucket is starting to spill or leak its lessons.  (On a longer project, the leakage will start before the project has ended, but let’s keep it simple for now and say that memories are still fresh).

So from this moment, your lessons start to leak.  The team will be disbanded, team members join other projects, and people start re-writing the history of their own involvement (particularly as they approach performance appraisal time!).

Leak!

Let's have a project review or "retrospect" to capture the lessons.  Good – but not a “watertight” process for learning everything that might be needed.

  • Are the right people in the room?  Team?  Customers? Sponsor? Suppliers?  Partners?
  • Are you asking the right questions? Enough questions?  The questions which others would have asked?
  • Are people responding thoughtfully?  Honestly? Are people holding back?  Is there politics or power at play which is influencing the way people respond?  Is the facilitator doing their job well?  Are they reading the room,  pressing for detail, for recommendations, for actions?

Leak!

And then we try to write-up this rich set of conversations into a lessons learned report.  However hard we try, we are going to lose emotion, detail, connections, nuances, the nature of the interactions and relationships – and all too often we lose a lot more in our haste to summarise. Polanyi and Snowden had something to say about that.

Leak!

And what happens to that report?  Is it lost in the bowels of SharePoint?  Is it tagged and indexed to maximise discovery?  Is it trapped on someone’s hard drive, or distributed ineffectively by email to “the people we thought would need it”?

Leak!

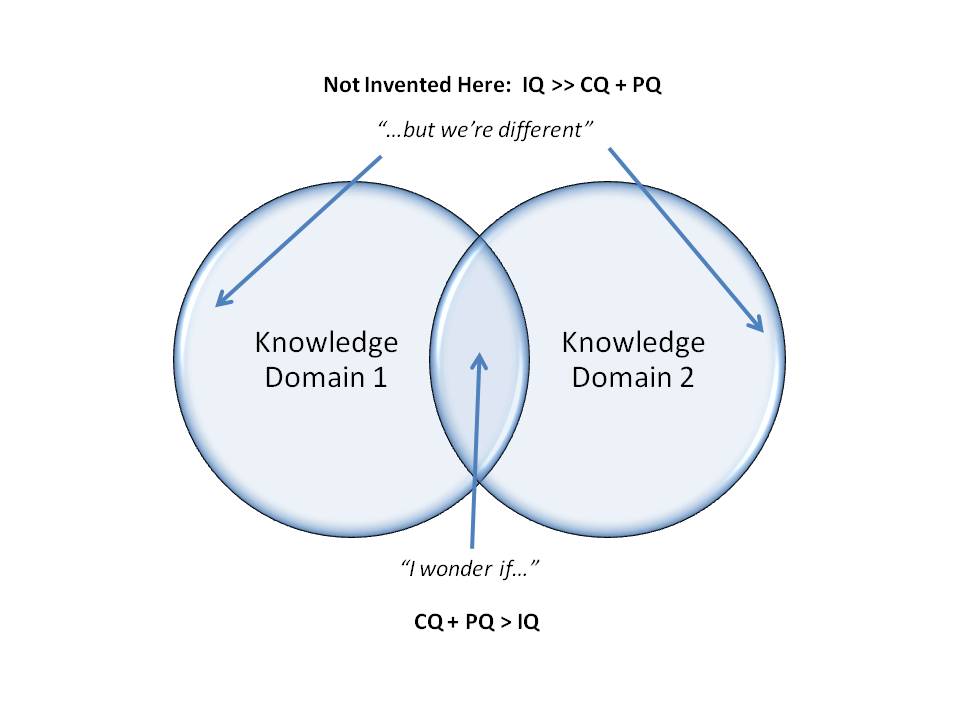
And of course, just because it’s stored, it doesn’t mean it’s shared! Sharing requires someone to receive it – which means that they have to want it.  Are the potential users of this knowledge thirsty? Curious?  Eager to learn?  Encouraged to learning rather than reinventing?  Infected with “Not invented here”?  Believe that their new project is completely different? Willing to root around in SharePoint to find those lessons? Willing to use the report as a prompt to speak with the previous team, and to invite them to a Peer Assist to share more of their learning?

Leak! Leak! Leak!

So you see, it’s a messy, leaky, lossy business,  and I think we need to be honest about that.  Honest with ourselves as KM professionals, and honest with our colleagues and customers.

That doesn’t mean that we shouldn’t work hard to address the leaks and losses - quite the reverse.  We should be anticipating and responding to each one.  Whether that means having a “knowledge plan” throughout the lifetime of a project, engaging leaders to set the right expectations, providing support/training/coaching/facilitation/tools etc.   There’s a lot we can do to help organisations get so much better at this.  They might not save the equivalent of a Refinery’s worth of value – but they might just make their workplaces more fulfilling, increase staff engagement and reduce their dependence on external consultants.

I think it starts with the business answering the question:


“Just how valuable do we really believe this knowledge is?”


If you look at the picture at the top of this blog and imagine it’s happening on a beach somewhere, then it’s just part of the fun in an environment of abundance.  You can fill the bucket up again and again...

If the picture was taken in a drought-stricken part of the world – an environment of scarcity – well that’s a different story.

KM Tools: Creating a River Diagram...

I'm often asked to explain what a "River Diagram" is, and how they can be used to shape knowledge management strategy, and as a way to help communities share and learn.  Geoff Parcell and I wrote a couple of chapters in "No More Consultants", but some how it's one of those topics always has me grabbing a sheet of paper, a whiteboard or a napkin to work through the steps in a more visual way.I'm sure that the guys at Commoncraft will do a great job on it one day...

So for now, in the spirit of vlogging, and with thanks to Geoff for the use of his green screen, here's a quick YouTube tutorial on "How to Create a River Diagram".

Target Practice

Image by Nelson Pavlosky Urinals.  Do you spend much time looking at them?

This is just a guess, but for half of you, I’m assuming that the answer is “no”.  The other half of you are wondering where I’m going with this line of enquiry.

 If you have had the pleasure of using the urinals at Schiphol Airport in Amsterdam, you will have noticed that each one is embellished with a lifelike image of a fly, under the glaze – just near the drain.  Initially I dismissed this as merely an example of quirky humour from a Dutch sanitary-ware manufacturer, but I was too hasty. Apparently, since incorporating the fly into their urinals, airports and other public places have noticed a decrease in the amount of cleaning required. Some of these have improved to the extent that they have saved money by reducing the number of cleaning shifts.    If you haven’t figured out the link between the fly and the cost reduction, ask any small boy!

All of this got me thinking about how on-target we are in the way we exchange knowledge, good practices, worst practices and stories.  Despite our best efforts, do people sometimes miss the mark when it comes to knowledge exchange? 

As knowledge professionals, we work hard to use processes and social technologies to bring people together collaboratively.  On some precious occasions, we get to design and facilitate face-to-face knowledge-sharing events.  Occasionally, we even get to work on leadership behaviours and organisational design. 

In all of these worthy activities, we sometimes forget that knowledge management can also help groups of people to agree upon and describe their practices – and hence connect and share more efficiently because they have negotiated a common language.

Here’s an illustration.  In KM circles, we have talked for years about the value of nurturing communities of practice, and rightly so.  However, if we were to turn our “Community of Practice toolkits” out onto the table, the majority of our tools play into the notion of Community: role descriptions and training programmes for leaders and facilitators, templates for community charters, designs for launch events, no end of technology options for social collaboration and document management.

But what about the Practice bit?  Do we have anything in our toolkits to offer groups of professionals who want to agree upon “what’s important” and describe “what good looks like”?  Yes, we can provide wikis where people can discuss and build glossaries, definitions and reference material, but that’s a platform, rather than a process.

I’m advocating that as Knowledge Management professionals, we should be able to offer any group a simple process for describing their practices qualitatively, thereby enhancing their knowledge-sharing.   That could involve the creation of a self-assessment tool (maturity model) – or perhaps a knowledge asset which helps others to navigate through a distillation of past learning, current good practice, examples and key contacts. 

That’s more than installing a wiki, a Drupal community or a set of SharePoint libraries.  It requires  us to roll up our sleeves and engage with the subject  experts and practitioners.  It involves us in helping them to agree and describe their practice in an accessible way.  By helping them to produce a common model of the practices which make up their functional area, they will be able to target their knowledge-sharing far more precisely, and hence get more value from KM tools and techniques.

Or to put it another way - if our knowledge workers have something more clearly defined to aim at, then we’ll have to spend less time clearing up after them.

 First Published in the October Edition of Inside Knowledge